Measuring Latencies
I’ve been instrumenting Neat VNC, noVNC and wlvncc to track end-to-end frame latency for the last couple of days. It is surprising how good a job noVNC actually does of decoding and rendering into a canvas element. The figures that I’m seeing are comparable to wlvncc, which is written in C!
Of course, noVNC actually relies on the browser to decode JPEG tiles for it, but it’s still mildly impressive. However, what isn’t impressive is Chromium’s rendering performance. When noVNC has submitted its buffer to the browser, it still takes it 50 ms, from that point in time, to reach my eyes. I measured this using the high speed video camera on my phone, comparing the time it takes for an input event to have an effect on the output between the browser and wlvncc. That is, I had both wlvncc and noVNC connected to the same server.
This post may feel overly verbose and scatterbrained, but I’m trying not to spend too much time on it at the cost of reduced brevity and conciseness.
Method
Network Time Protocol
When profiling processes that run on the same machine, you normally have the benefit of being able to access the same monotonic clock source from all processes. You just need to pass a timestamp with the frame and check the difference between the time at which the frame was rendered and the frame’s associated presentation timestamp that came from the server.
However, you do not have access to the system clock from within the browser. This makes it so that it’s not simply enough to pass a timestamp with the frame. The client and server also need to have some form of clock synchronisation as if they were on different machines.
This is where NTP comes in. Some streaming protocols such as AirPlay implement an NTP inspired time synchronisation mechanism. This is used to translate timestamps between different machines, and this is what I did.
In short, it works like this: The client sends a ping along with its own time, \(t_0\). The server records the time when it received the message \(t_1\) and then sends back a message containing the \(t_0\), \(t_1\) and the time at which the server sends the message, \(t_2\). The client receives the response, calculates its own reception time \(t_3\) and calculates the clock offset, \(\theta\) and the round-trip-time, \(\delta\):
\[\theta = \frac{(t_1 - t_0) + (t_2 - t_3)}{2}\] \[\delta = (t_3 - t_0) - (t_2 - t_1)\]The round trip time on its own is good to know because it tells you the network latency, although it doesn’t tell you the latency in each direction. However, we’re more interested in it for another reason: the accuracy of \(\delta\). If you sample \(\theta\) over time, you’ll see a graph similar to the one below.
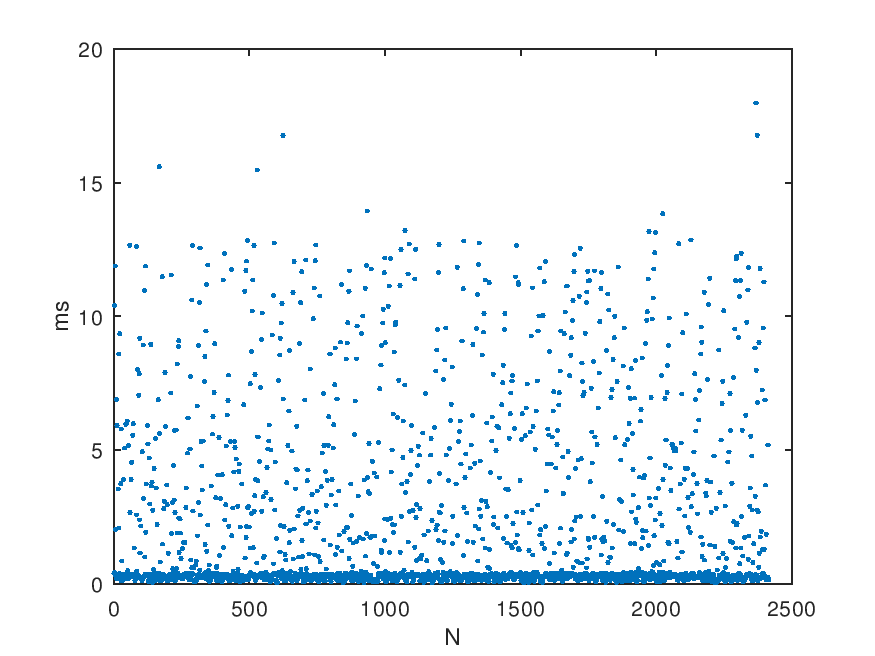
What you’ll see is an almost horizontal (depending on clock skew) with some fuzz above it. The bottom line is your best-case round-trip time and the data points above it are packets that got delayed somewhere on the way. Most likely, they got delayed by the system on their way out or in. This means that the data inside those packets is less accurate than for the low \(\delta\) ones. It is less accurate because one or more of the timestamps is not as close to the actual time that the packet was sent or received on the wire as for a packet with lower \(\delta\).
If I plot \(\delta\) on the x-axis and \(\theta\) theta on the y-axis for the same data set as show above, it’s pretty damning. This is all sampled using the same clock on the same computer, so the time difference, \(\theta\) should be close to zero.
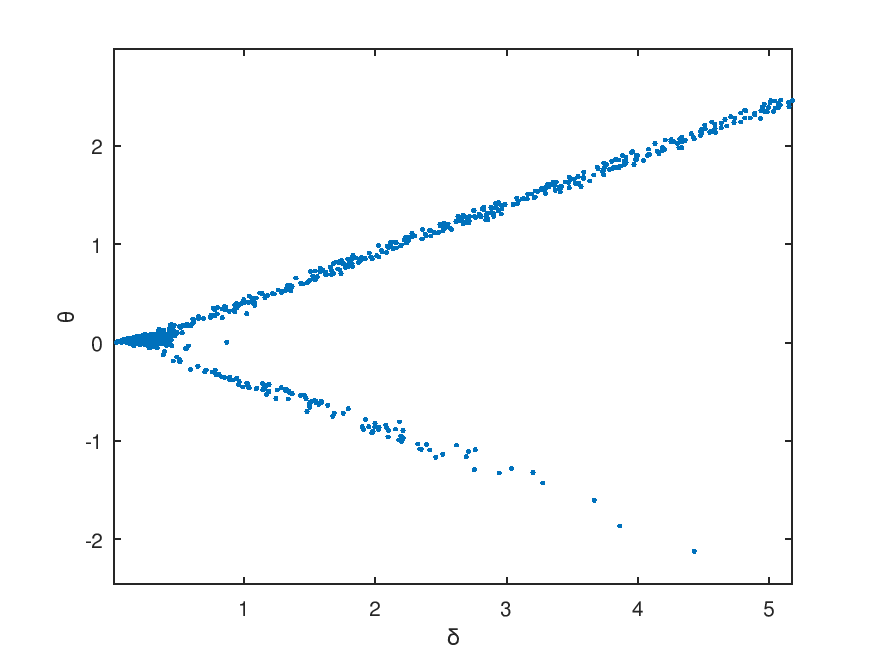
What this all means is that we should try to pick samples that have low \(\delta\). A common method, which I’ve chosen to use, is to put the samples comprised of \(\theta\) and \(\delta\) into a ring buffer of a pre-determined size and then select the sample with the lowest \(\delta\) from that buffer when I need to do a time stamp translation.
In C, it looks like this:
bool ntp_client_get_best_sample(const struct ntp_client* self,
		struct ntp_sample* out)
{
	if (self->sample_count < NTP_MIN_SAMPLE_COUNT)
		return false;

	struct ntp_sample result = {
		.theta = 0,
		.delta = UINT32_MAX,
	};

	for (int i = 0; i < self->sample_count; ++i) {
		const struct ntp_sample *sample = &self->samples[i];
		if (sample->delta < result.delta) {
			result = *sample;
		}
	}

	*out = result;
	return true;
}

bool ntp_client_translate_server_time(const struct ntp_client* self,
		uint32_t* dst, const uint32_t t)
{
	struct ntp_sample sample;
	if (!ntp_client_get_best_sample(self, &sample))
		return false;

	*dst = (int32_t)t - sample.theta;
	return true;
}
My workmate Kristján tought me some of these things about NTP this one time when I walked by his office and saw some interesting graphs on his screen and decided to ask him about them. Thanks Kristján!
New VNC Protocol Extensions
Presentation Time Stamp (PTS)
Currently, the VNC protocol doesn’t have any idea about presentation timestamps. It just presents frames when it receives them. Most people who know anything about media streaming and smooth playback might find this appalling, but it is what it is.
Being that there is a lack a way to pass a timestamp with a frame in the VNC protocol, we’ll just have to create a protocol extension.
Each frame buffer update sent by the server contains a set of rectangles. The rectangles are normally encoded pixels that represent a certain area of the screen, but they may also represent other things. Those are called pseudo encoded rectangles because the don’t actually represent pixel data.
Thus, to associate a PTS with a frame, all we need to do is to create a new pseudo encoding and send it with the frame as a rectangle.
NTP
Since VNC doesn’t really know anything about time, we’ll also have to add an NTP inspired protocol extension as described earlier. This is a bit different from the PTS extension as we don’t need or want NTP messages to be associated with a frame.
This requires a new message type. For simplicity, the message layout is symmetrical for the server and the client and contains all 4 timestamps even though only 1 of them is set by the client in the first message and 2 by the server in its response. The client may send a final message to the server containing all for timestamps so that the server can also measure latency and translate timestamps.
Setup
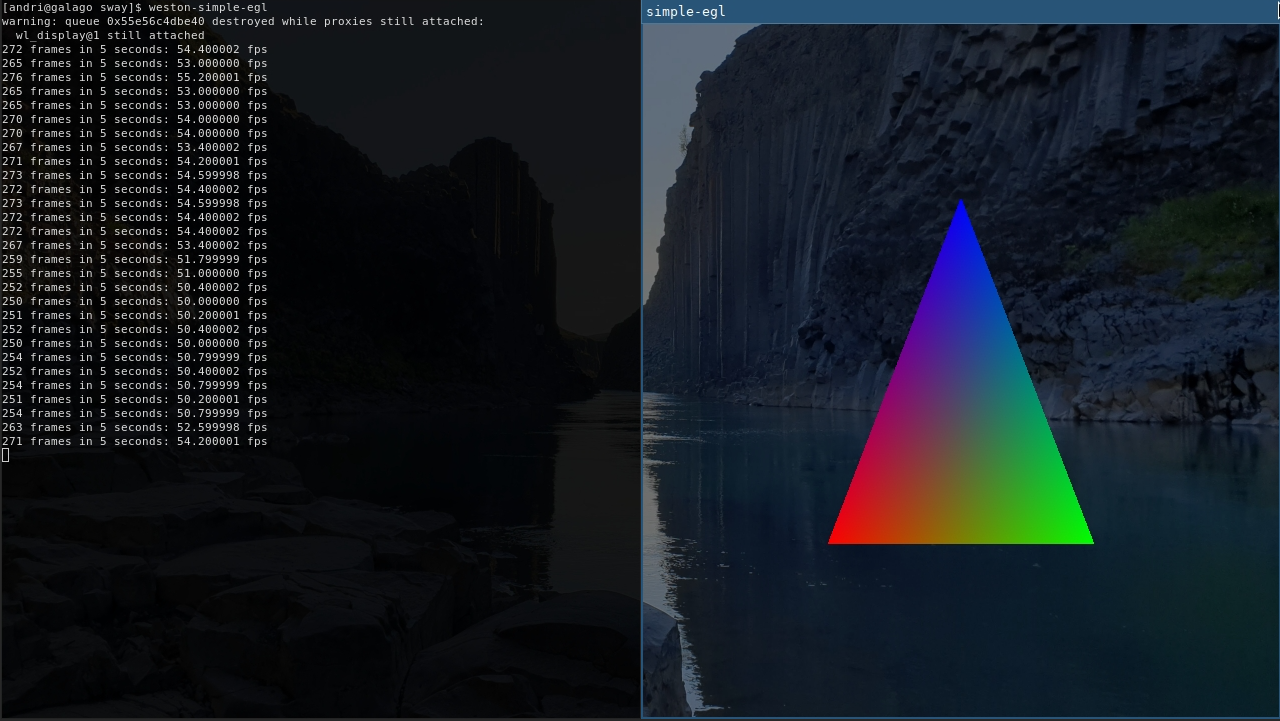
I ran sway and wayvnc like like so:
WLR_BACKENDS=headless WLR_RENDERER=pixman ./build/sway/sway

WAYLAND_DISPLAY=wayland-2  ./build/wayvnc
This results in a headless sway session running with a resolution of 1080p and wayvnc capturing at 30 fps.
Inside sway, I ran the foot terminal emulator and weston-simple-egl.
The VNC socket was proxied by websockify for noVNC, but I also tried this with native WebSocket in wayvnc and it did not seem to have any effect on latency.
Summary of Methodology
- The client learns the offset of the server’s clock relative to its own using an NTP inspired protocol extension.
- The server sends a PTS with every frame.
- The client decodes and renders the frame and then checks the time.
- The PTS is subtracted from the time at which rendering completed to get the total frame latency for that frame.
- Please note that this does not take into account presentation latency after the client has rendered the frame. Normally, this should not exceed 16.66 ms.
- Each latency sample is put into a buffer that discards the oldest sample and keeps the 60 newest samples.
- From this buffer, statistics are calculated periodically.
- The calculation includes minimum, maximum and average latency.
Results
noVNC & Chromium
These latency reports are logged out every quarter of a second using
console.log(). I trimmed away the file name.
Latency report: total frame latency (min, avg, max): 5.8, 11.0, 27.7 ms, best case network latency: 0.4 ms, decoding latency: 3.5 ms
Latency report: total frame latency (min, avg, max): 5.6, 10.6, 24.4 ms, best case network latency: 0.4 ms, decoding latency: 2.7 ms
Latency report: total frame latency (min, avg, max): 5.6, 10.6, 24.4 ms, best case network latency: 0.4 ms, decoding latency: 2.9 ms
Latency report: total frame latency (min, avg, max): 5.6, 11.3, 24.4 ms, best case network latency: 0.4 ms, decoding latency: 3.5 ms
Latency report: total frame latency (min, avg, max): 5.6, 10.9, 24.4 ms, best case network latency: 0.4 ms, decoding latency: 3.2 ms
Latency report: total frame latency (min, avg, max): 5.6, 10.7, 24.4 ms, best case network latency: 0.4 ms, decoding latency: 2.8 ms
Latency report: total frame latency (min, avg, max): 5.6, 10.3, 24.4 ms, best case network latency: 0.4 ms, decoding latency: 2.4 ms
Latency report: total frame latency (min, avg, max): 5.6, 10.3, 26.3 ms, best case network latency: 0.4 ms, decoding latency: 3.3 ms
Latency report: total frame latency (min, avg, max): 5.6, 10.1, 26.3 ms, best case network latency: 0.4 ms, decoding latency: 2.9 ms
wlvncc
These are the same figures as for noVNC, except I didn’t bother with adding the network and decoding latency figures.
Latency report: frame-latency (min, avg, max): 4.3, 11.3, 20.7
Latency report: frame-latency (min, avg, max): 4.3, 11.5, 20.7
Latency report: frame-latency (min, avg, max): 4.3, 12.1, 20.7
Latency report: frame-latency (min, avg, max): 4.3, 11.9, 19.9
Latency report: frame-latency (min, avg, max): 4.3, 11.9, 19.9
Latency report: frame-latency (min, avg, max): 4.3, 12.0, 19.9
Latency report: frame-latency (min, avg, max): 4.3, 11.9, 19.6
Latency report: frame-latency (min, avg, max): 4.3, 12.2, 19.6
Latency report: frame-latency (min, avg, max): 4.3, 12.2, 19.6
Latency report: frame-latency (min, avg, max): 4.3, 12.0, 20.0
Discussion
The following are some observations that I’ve made during my experiments:
- The numbers are very similar between wlvncc and noVNC. Things appear to be off by 5 ms at most.
- Lighter rendering load causes less latency. Smaller change means less time encoding & decoding. Just moving the cursor around is a lot quicker.
- Even though the latency that I can measure seems very low, the reality is that interacting with things via noVNC feels rather sluggish due to that extra 50 ms latency that I’ve observed.
Now, it would be interesting to know what’s taking so long in Chromium, but the browser is a beast, and taking it on is a much larger project than what I’ve done so far in instrumenting these 3 projects. If you read this and you happen to be an expert on these matter, please contact me!